A wrapper function to plot panelmap with one line command
makepanel.RdA wrapper function to plot panelmap with one line command, which internally calls panelet_category, panelet_group, and panelet_continuous. One can pass all parameters in one go. For panelet level customization, use without wrapper function
makepanel(gr,gr.name="Group",gr.col,mat,mat.col,mat.type,legend=FALSE,
get.pval=FALSE,NA.flag=FALSE, NA.col="grey",border=FALSE,
border.col="black",lnrow=3,lncol=5,lcex=1,legend.vec=NULL,legend.col=NULL, lheight=1, ...)
Arguments
| gr | required. vector. Class or group labels. see |
|---|---|
| gr.name | a string, name for your class or group labels |
| gr.col | required. a vector of colors specified for each class in |
| mat | required. data frame. of values that you want to plot. Make sure they are ordered in the same order as |
| mat.col | required. list. of color values to be coded. names of the list are column names of |
| mat.type | required. vector. type of data type in mat. |
| NA.flag | logical, default is |
| NA.col | default is "grey". see |
| get.pval | logical, default is |
| border | logical, default is |
| border.col | default is |
| legend | logical. default is |
| lnrow | numeric. Number of rows in each panelet of the legend. Adjust to fit in plot margins. Default is 3 rows. See |
| lncol | numeric. Number of columns on each panelet of the legend. Adjust accordingly for legibility. Default is 5 columns.Only when |
| lcex | numeric. Magnification of legend labels. Default value is |
| legend.vec | vector. When |
| legend.col | vector. When |
| lheight | numeric. If your legend overflows the current |
| ... | pass optional arguments here |
Details
... can pass other parameters. Use it for controlling names and colors of panelets via cex, col. border line type and thickness can be controlled via lty and lwd respectively.
Value
A colored panelemap of discrete/continuous values is plotted ordered according to the group labels as specified.
See also
makepanel
Examples
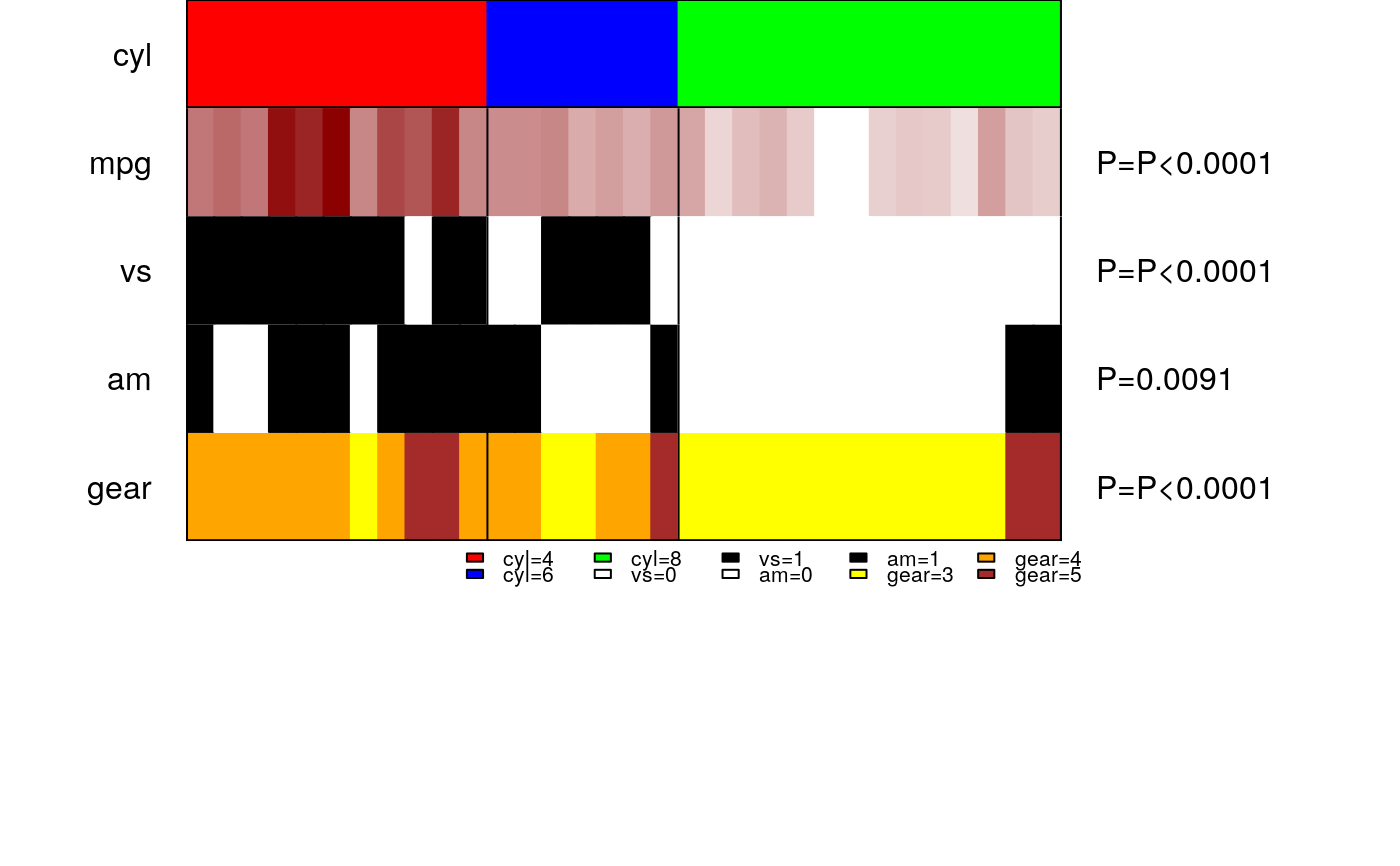
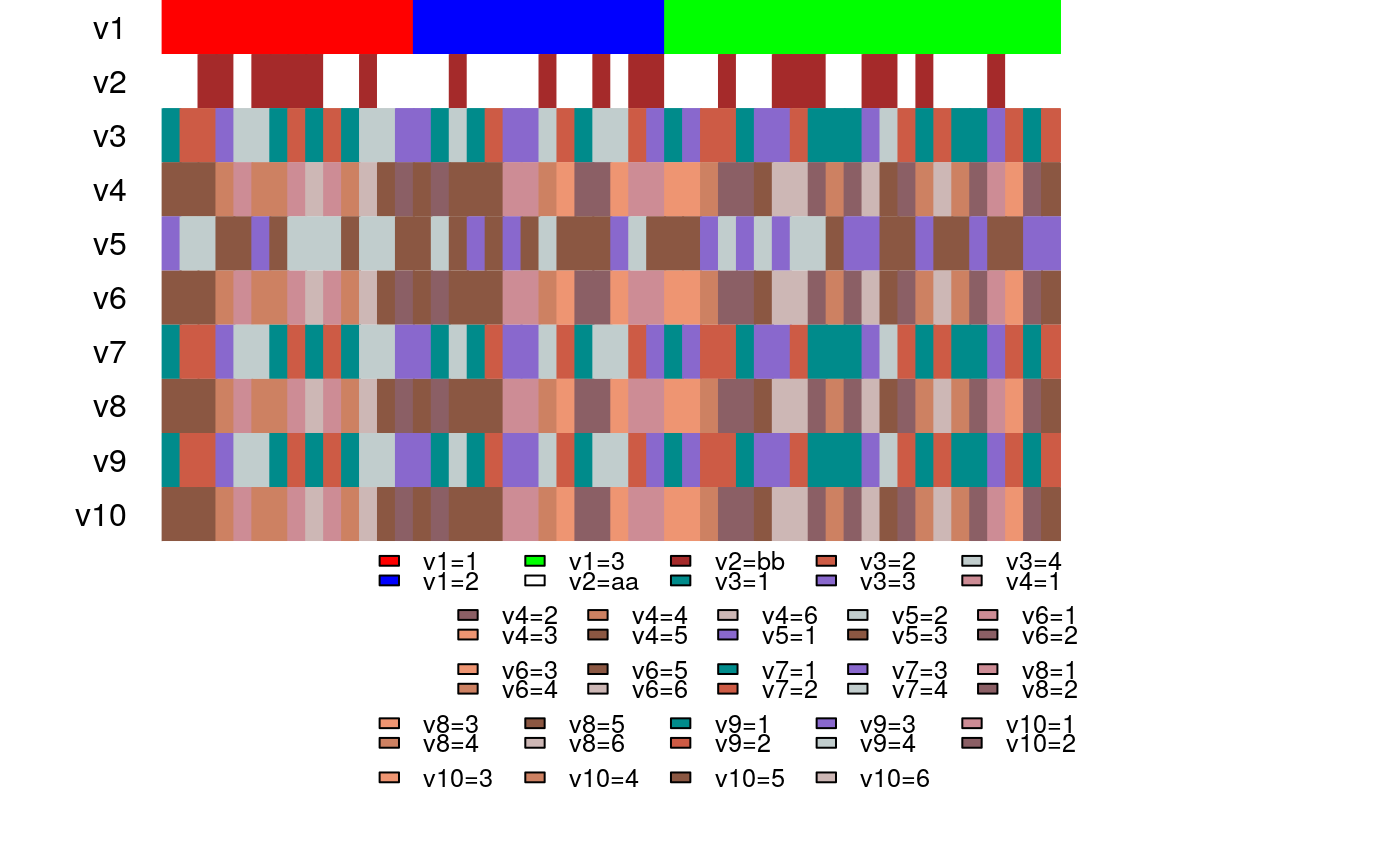
#sort everything by cyl mtcars.sort = mtcars[order(mtcars$cyl),] #other features to plot mat = mtcars.sort[,c("mpg","vs","am","gear")] #color assigned to each feature mat.col=list(am=c("white","black"), vs=c("white","black"), gear=c("yellow","orange","brown"), mpg=c("white", "darkred")) #type of each feature. type=1 for discrete and type=2 for continuous. mat.type= c(2,1,1,1) tab=makepanel(gr=mtcars.sort$cyl, gr.name="cyl",gr.col=c("red","blue","green"), mat=mat, mat.col=mat.col, mat.type=mat.type, border=TRUE, legend=TRUE, get.pval=TRUE, cex=1)#>#>#>#>#example to adjust for legend parameters v1=v5= sample(c(1:3),50, replace=TRUE) v2 = sample(c("aa","bb"),50, replace=TRUE) v3 = v7 = v9 = sample(c(1:4), 50, replace=TRUE) v4 = v6 = v8 = v10 = sample(c(1:6), 50, replace=TRUE) mat = cbind(v2,v3,v4,v5,v6,v7,v8,v9,v10) mat.type = rep(1,9) col4 = c("cyan4", "coral3", "mediumpurple3", "azure3") col6 = c("lightpink3", "lightpink4", "lightsalmon2", "lightsalmon3","lightsalmon4", "mistyrose3") mat.col = list(v2 = c("white", "brown"), v3 = col4, v7 = col4, v9=col4, v4=col6, v6=col6, v8=col6, v10=col6, v5=c("mediumpurple3", "azure3", "lightsalmon4")) v1 = v1[order(v1)] makepanel(v1, "v1", c("red","blue","green"), mat, mat.col, mat.type, legend=TRUE, lnrow=2, lncol=5, lcex=1.2, lheight=4)