panelmap 
Introduction
panelmap creates panels for summarizing binary data, categorical data (more than 2 categories) and continuous data for known groups. Groups can arise from classification algorithms such as kmeans, or other class labels as provided by the user. panelmap is a visual aid to understand associations and trends in data instead from tedious tables and trying to infer multiple plots.
Each row of panelmap is called a panelet (singular). Many panelets assemble together to make a panelmap . We first begin by making a panelet for the solution. See panelet_group. Rest of the variables are plotted according to the nature of the data - discrete (binary/categorical) - See panelet_category , or continuous - See panelet_continuous . The function, makepanel , is a wrapper function of the above mentioned functions.
makepanel is a wrapper function that outputs a legend, an association table and the panelmap, all with one command. You need to provide the meta information of your data set like, colors, data type, labels color etc.
We will use mtcars data set to illustrate the usage of panelmap.
See below an example of panelmap.
Example - panelmap
We will illustrate panlemap by sorting mtcars data according to variable cyl and plotting mpg, vs, am and gear to understand the relationship between them.
#sort everything by cyl
mtcars.sort = mtcars[order(mtcars$cyl),]
#otehr features to plot
mat = mtcars.sort[,c("mpg","vs","am","gear")]

#color assigned to each feature
mat.col=list(am=c("white","black"), vs=c("white","black"), gear=c("yellow","orange","brown"), mpg=c("white", "darkred"))

#type of each feature. type=1 for discrete and type=2 for continuous.
mat.type= c(2,1,1,1)
tab=makepanel(gr=mtcars.sort$cyl, gr.name="cyl",gr.col=c("red","blue","green"), mat=mat, mat.col=mat.col, mat.type=mat.type, border=TRUE, legend=TRUE, get.pval=TRUE)
## Performing Kruskal-Wallis test
## Performing Fisher's Exact test
## Performing Fisher's Exact test
## Performing Fisher's Exact test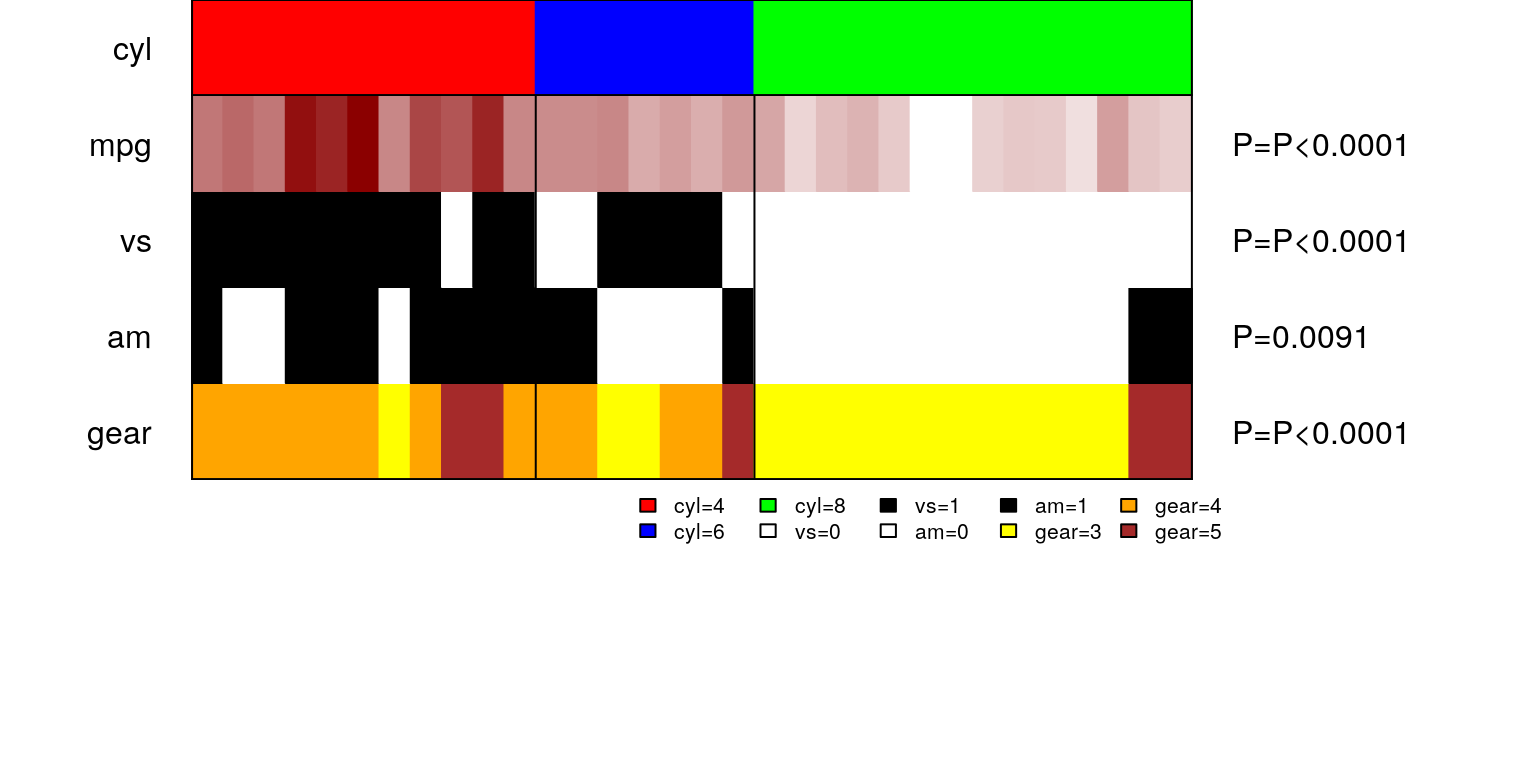
One can see, how all the variables align with vehicles with 4,6 and 8 cylinder engines, all at a single glance!
vs - Binary variable signaling the engine cylinder configuration a V-shape (vs=0) or Straight Line (vs=1). V
am - A binary variable signaling whether vehicle has automatic (am=0) or manual (am=1) transmission configuration.
| 4 | 6 | 8 | RowTotal | pval | |
|---|---|---|---|---|---|
| mpg | 26[21.4-33.9] | 19.7[17.8-21.4] | 15.2[10.4-19.2] | P<0.0001 | |
| NA | 0 | 0 | 0 | ||
| vs | P<0.0001 | ||||
| 0 | 1(9%) | 3(43%) | 14(100%) | 18(56.25%) | |
| 1 | 10(91%) | 4(57%) | 0(0%) | 14(43.75%) | |
| am | 0.0091 | ||||
| 0 | 3(27%) | 4(57%) | 12(86%) | 19(59.38%) | |
| 1 | 8(73%) | 3(43%) | 2(14%) | 13(40.62%) | |
| gear | P<0.0001 | ||||
| 3 | 1(9%) | 2(29%) | 12(86%) | 15(46.88%) | |
| 4 | 8(73%) | 4(57%) | 0(0%) | 12(37.5%) | |
| 5 | 2(18%) | 1(14%) | 2(14%) | 5(15.62%) |
Association table corresponding to panelmap
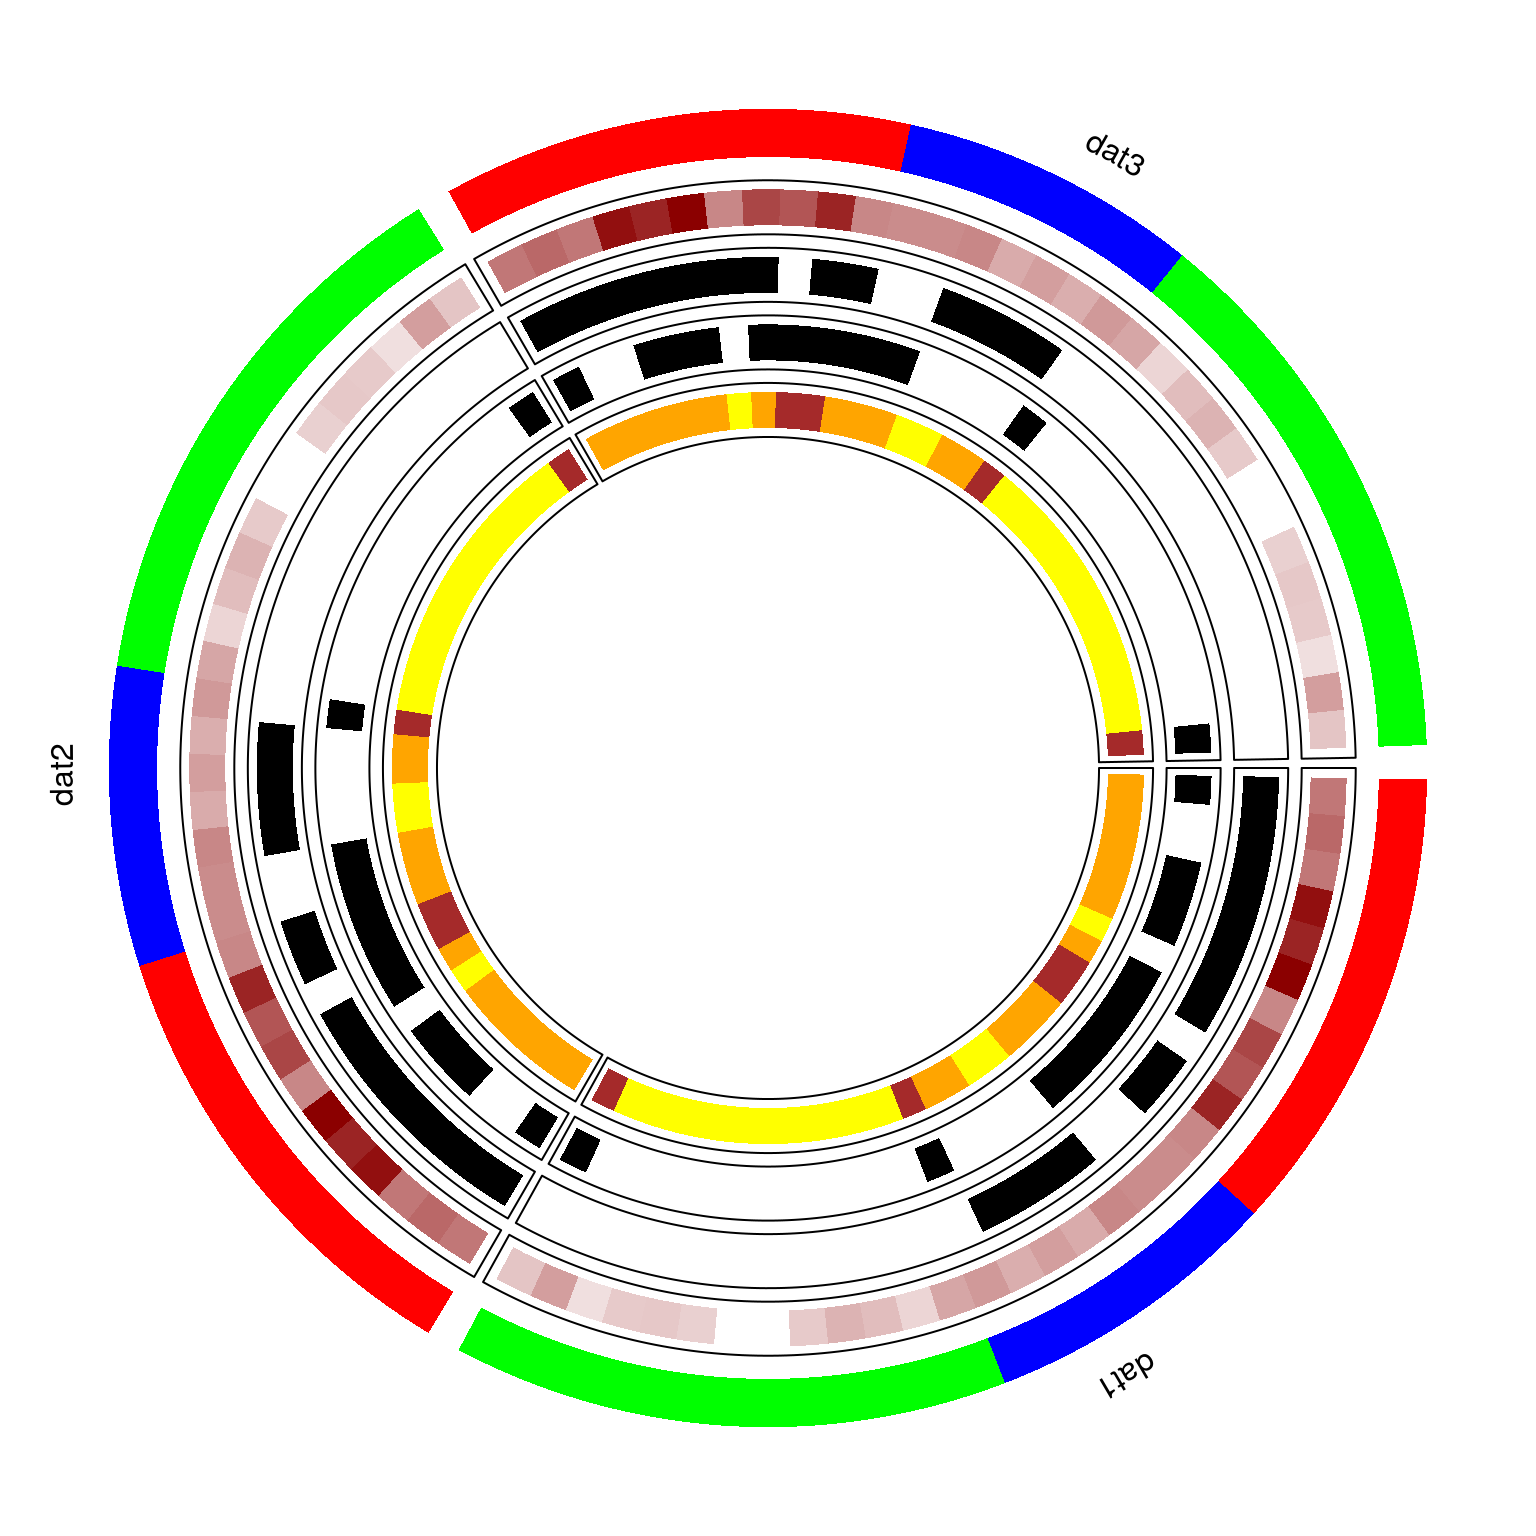
Example - circomap
circomap is a visualizing tool to plot and analyze multiple panelmaps, inspired by the circlize1 package.
To illustrate the functionality of circomap we will draw the above panelmap three times in a circular layout.
#dataset 1
dat1 = mtcars[order(mtcars$cyl),]
#dataset 2
dat2 = mtcars[order(mtcars$cyl),]
#dataset 3
dat3 = mtcars[order(mtcars$cyl),]

#put all the datasets in a list
datasets<-list()
datasets[[1]]=dat1; datasets[[2]]=dat2; datasets[[3]]=dat3
names(datasets) = c("dat1", "dat2", "dat3")
#names of datasets will be used to labek the datasets

#group variable to plot same as panelet_group
gtoplot<-c("cyl")
gcol = c("red","blue","green")
gheight = 0.10 #track height of the group variable

#features to plot - same as in panelmap example
ftoplot<-c("mpg", "vs", "am", "gear")
ftype= c(2,1,1,1)
fcol=list(am=c("white","black"), vs=c("white","black"), gear=c("yellow","orange","brown"), mpg=c("white", "darkred"))

fheight<-list(); fheight[1:length(ftoplot)] = 0.08
#Voila!!
circomap(datasets, gtoplot, gcol, gheight, ftoplot, ftype, fcol, fheight)