plots categorical values in the order specified by class labels
panelet_category.RdPlot discrete categorical values belonging to class labels. Each category can have a unique color and a color for missing if exists. User has the option to perform an association test and output p-value and a contingency table summarizing count and proportion.
panelet_category(pp,pp.col,gr, var.n="var.n",NA.flag=FALSE,
NA.col="grey", get.pval=FALSE, border=FALSE, border.col="black", legend=FALSE,...)
Arguments
| pp | required. vector. A vector of categorical values of interest |
|---|---|
| pp.col | required. vector. A vector of colors of the same length as the unique values in the categorical variable of interest |
| gr | required. vector. Class labels as passed to |
| var.n | character. A character specifying the name of the variable. Set to |
| NA.flag | logical, default is |
| NA.col | default is "grey". see |
| get.pval | logical, default is |
| border | logical, default is |
| border.col | default is |
| legend | logical. default is |
| ... | pass optional arguments here |
Details
... can pass other parameters. Use it for controlling names and colors of panelets via cex, col. border line type and thickness can be controlled via lty and lwd respectively.
A colored panelet of categorical values is plotted. Make sure the variable is ordered according to the group labels in panelet_group.
Value
A colored panelet of categorical values is plotted.
if legend = TRUE, returns a key mapping the group labels to specific color
if get.pval =TRUE, returns a table summarizing the counts and proportions along with a p-value from Fisher's Exact Test
See also
makepanel
Examples
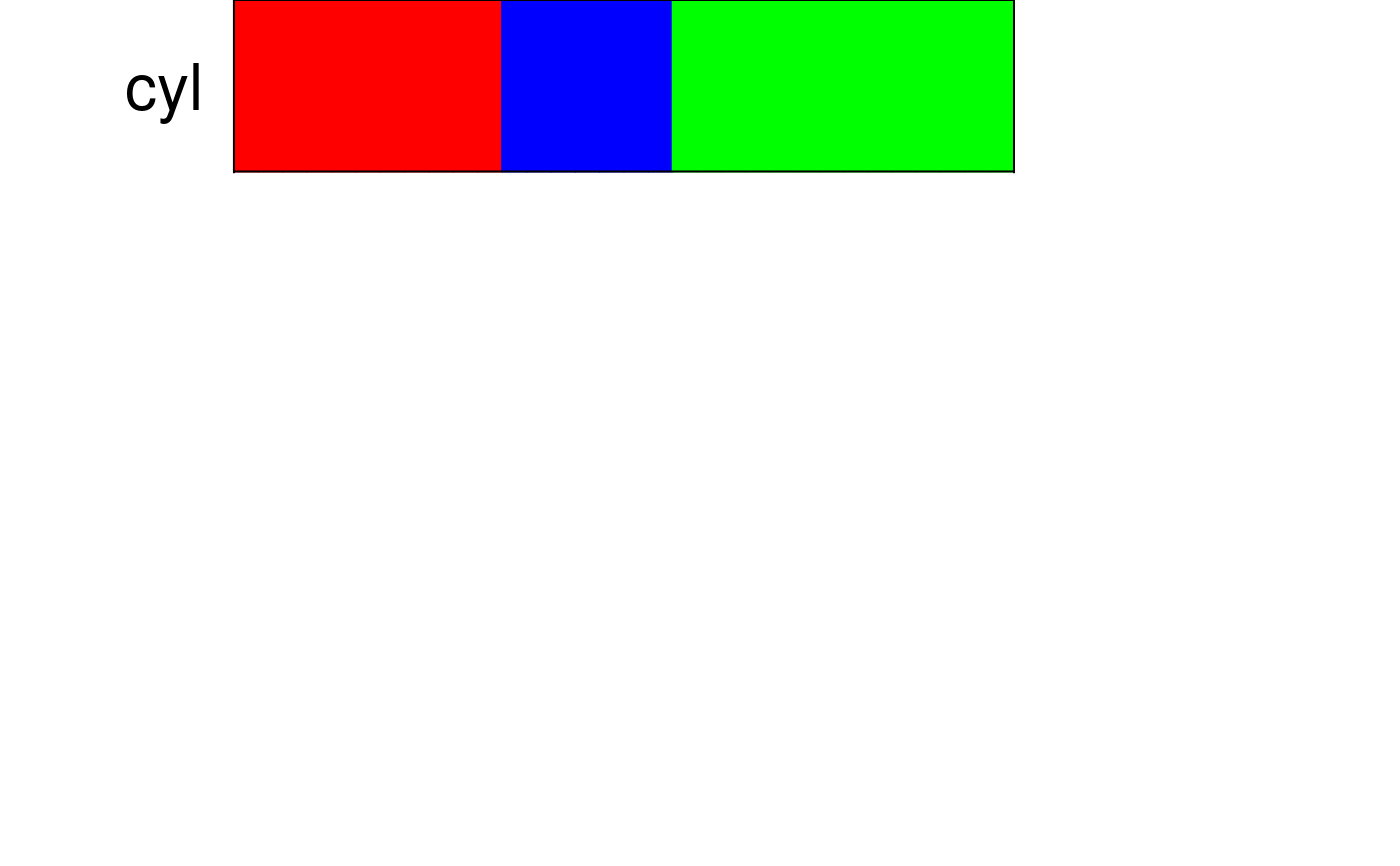
#adjust margins and number of panelet values
par(mfrow=c(5,1),mar=c(0,8,0,14))

#sort the entire data frame according to the group solution you are interested in
mtcars.sort = mtcars[order(mtcars$cyl),]

#plot group
panelet_group(gr=mtcars.sort$cyl, gr.col=c("red","blue","green"),
gr.name="cyl",cex=2, border=TRUE, legend=FALSE)#> $key
#>     [,1]  [,2]   [,3]
#>     "4"   "6"    "8"
#> col "red" "blue" "green"
#>